Out of curiosity, I decided to deep dive into my Instagram post performance. The data points I’ll be sharing were taken from my own Instagram account (@PotatoArtStudios) from February 2021. Keep in mind that Instagram, Facebook, TikTok, and other social media sites will have different algorithms and often change how posts are shared and prioritized.
Before we go into analyzing numbers, we have to look at the bigger picture. Most social media platforms are free to join, upload, and share content. Social media sites make money by inserting paid advertisements in-between “normal content” made by your friends, family, and people you follow. In the case of this post, “content” on Instagram is videos and still images.
Knowing this simple fact, social media sites reward “good” content that keeps users on the site, and punish “bad” content that cause people to close the app or engage less. If your post is “good,” this means that a high percentage of people who see your content like, save, and comment on your posts. Instagram measures these types of interactions as “engagement.”
My personal history with Instagram
I have been regularly posting to Instagram for over 3 years now. On average I aim to share 3-6 posts and 5-7 stories a week. I use an average of 10-15 hashtags for a post, and I rotate between different tags. There are accounts that post far more than I do, and there are accounts that post less.
This blog is not intended to make you feel pressured to change how often you upload to social media. I am reporting and analyzing my own content. You can apply these findings to your own social media strategy if you feel that my insights will help your account.
Starting in 2021, I noticed an unusual dip in the average number of likes in my posts and my number of followers stagnated. My content and upload schedule is fairly consistent (I post only artwork of animals at the same frequency and time of day), so I knew that it wasn’t likely that my artwork was probably not the issue. I had my suspicions that Instagram (once again) changed something in how they prioritized posts and my content was being deliberately shown to less people.
I didn’t have any hard evidence at first, but I knew that I could monitor my posts and observe if there were trends happening.
The Data
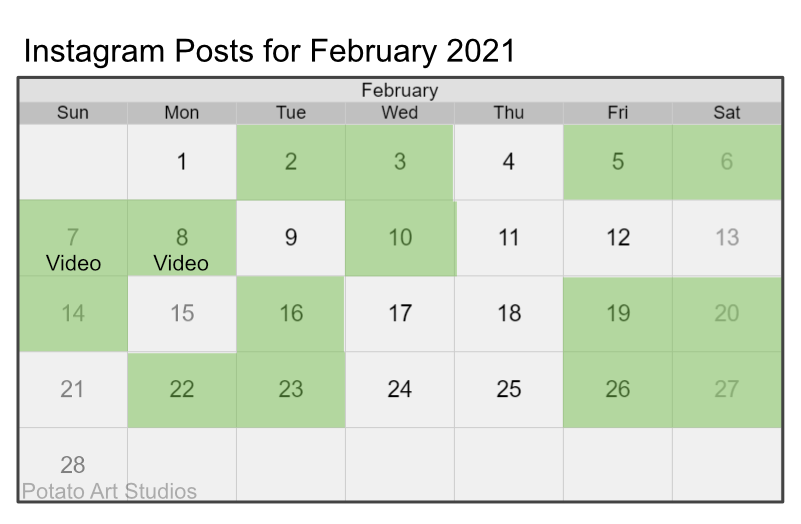
So let’s look at the month of February 2021.
I did some reading and came across several articles where artists were reporting Instagram employees were offering consultation sessions to help their accounts grow. The one surprising common theme in these findings was the sheer quantity of content that Instagram was pushing the artists to upload and the emphasis on video content.
Prior to 2021, the majority of my uploads to Instagram were still images. I decided to see if video content actually did better. If you are curious about repeating this analysis on your own Instagram account, you may need to switch from a personal to business account under your settings.
Analysis
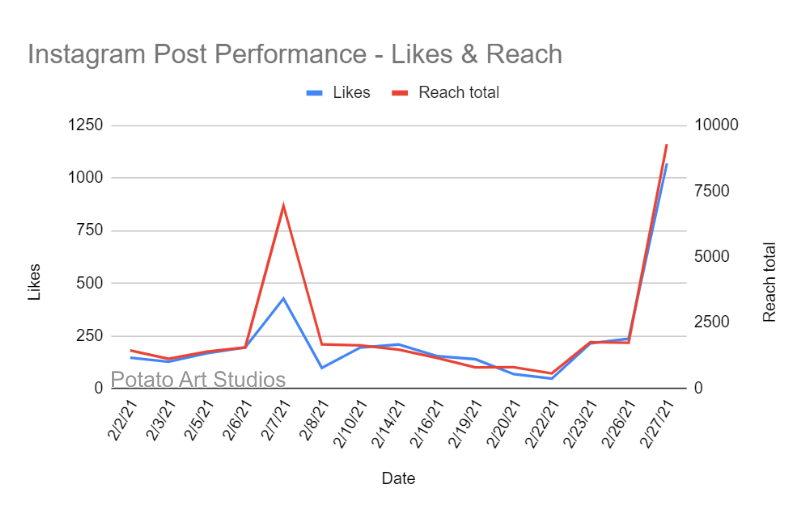
From initial observations, the two large spikes in February 7 and 27, 2021 were the two posts that I would classify as “viral.” Labeling a post as “viral” is a very vague term. In this context, I use it when I see content that achieves significantly more reach and likes than an average post by a factor of 4 or more.
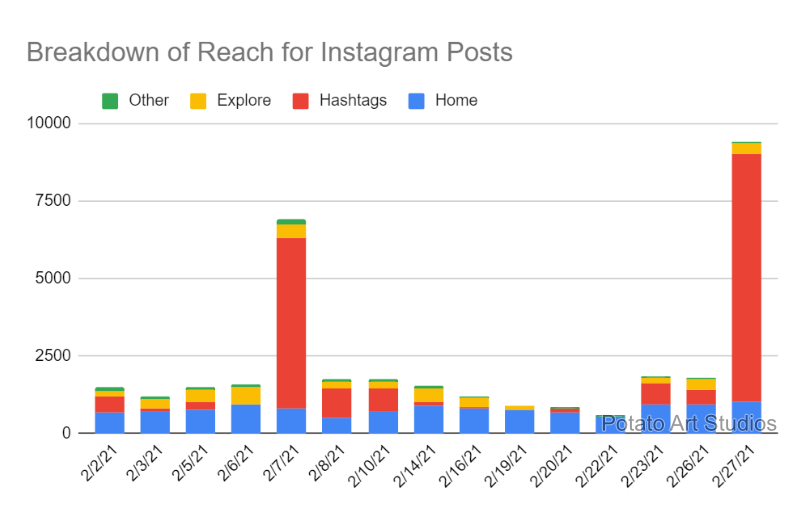
For an even closer look at my individual post reach, I made a chart showing the relative reach from the different places Instagram can share your work. You’ll notice that the blue bar (Home) is fairly consistent between all of my posts. The “Home” reach is from accounts that already follow my Instagram so my content routinely is displayed in their main feed.
The biggest difference between day-to-day post performance is the percentage of new accounts who see my content through Hashtags (red bar) and the Explore page (yellow bar). When a post performs exceptionally well, the amount of reach from one “viral” post is equivalent to 1-2 weeks of “average” performing posts.
I did not post many videos to Instagram in February 2021, so I looked over my analytics from the past 3 months and displayed the top 9 posts in the metric of reach and likes from December 2020 through February 2021. Surprisingly, 6 of the 9 highly viewed and liked content were video posts. Considering that only 13 of the 68 posts in the last 3 months were videos, nearly 50% of my videos became “viral” posts.
Video posts did not always do better than still image posts. But on average, video posts performed better. I believe this is because the threshold for engagement on video content is much lower for videos than for still images.
It is difficult to pinpoint the exact moment when engagement rate of a post is evaluated as “good” according to Instagram. I believe this happens in the first few hours after a post is uploaded to Instagram.
Once a post is categorized as “good” content, it is shown to more accounts through the hashtags, and the content is shown to other users through the Explore page. If you are not familiar with Instagram’s “Explore” page, it is similar to TikTok’s “For You” page where new content is displayed based on your interests from accounts you are not currently following. If your goal is to increase your following, you likely want your content to be shown to as many new people as possible who are interested in what you create.
From the post insights of my content:
- Still image posts require an engagement rate of 15-20% to be promoted through hashtags
- Video posts require an engagement rate of 5-10% to be promoted through hashtags and the explore page
The engagement rate formula is the number of interactions on a post divided by the total number of accounts that the post is shown to. For example, if your post is shown to 100 accounts – if 10 people like your post, your engagement rate would be 10%.
Conclusions and how I plan on using Instagram in 2021
My biggest takeaway from the analysis of my own post performance is that creating video content needs to be a priority in order for new accounts to view my artwork through the Explore page or hashtags. Although I consider my audience on Instagram to be very kind and interactive, the current average engagement rate requirements will lead to nearly zero growth due to the changes in how Instagram ultimately restricts who can see my account when I post new content.
Historically, a universal “good” engagement rate on Instagram was 3-5% in 2019 and 2020. So asking for a 20% engagement rate is almost impossible with my current audience. I realized that because most of my content was still images, it had a much higher threshold to meet before my post could be shown to more people.
Video posts require more processing and setup time than just taking a simple photo. While an average photo usually needs a few adjustments before it is “Instagram-ready”, a video post usually requires setting up a tripod and camera. Then the video editing involves uploading the files to my computer, adding music, clipping, color adjusting, cropping, and adding watermarks. The editing process can take anywhere from 20 minutes to several hours for a full time-lapse video.
I plan on reducing slightly the number of posts I share a week to compensate for the additional time editing video posts. Although the common push among most social media creators is to create a lot of content, I think that my personal path will be to post every other day and focus on creating interesting or helpful art content to my followers.
Additional Notes
I did not mention the short video format category on Instagram called “Reels” in this blog post because I do not consistently upload to Reels. Content for Reels promotes vertical format filming and video editing within the Instagram app. Although I have created a few Reels in the past, I prefer to create normal video posts. If you are already familiar with TikTok, you may find creating Reels on Instagram to be a fun way to make content.
If you have any additional insights or tips you would like to share, comment below! We can always use a second (or third) opinion when it comes to understanding the mysterious “algorithm.”
-Lauren